Health Checks (Beta)
Health Checks are a lightweight monitoring mechanism that lets a Tributech Agent and its connected Tributech Sources report their current operational state to the Tributech Node in near real time.
Health Checks are currently a Beta feature and are only accessible via the REST API — there is no dedicated view in the Tributech Node UI yet.
Health Checks require Tributech Agent version 5.4.0 or later, and the Digital Twin models of both the agent (device) and its sources must be version 3 or higher (;3+). Older model versions do not include the health-check telemetry. See Digital Twin Versions for how to upgrade.
The windowed indicators require Tributech Agent version 5.5.0 or later and health message model ;2. An older Agent reports the same health states, but derives them from point-in-time values only.
What a Health Check is
A Health Check is a periodic, push-based status message sent by an Agent or a Source that reports whether the component is operating correctly — and, if not, why. Each message contains a structured health status, a timestamp and technology-specific diagnostic indicators, and it is cryptographically signed by the sending device, exactly like a Tributech Stream.
In short, a Health Check answers: “Is this Agent or Source operating correctly right now — and if not, why?”
Unlike relying on missing data to infer a problem, Health Checks actively report health conditions, which enables early detection of degraded states — such as a lost Agent-to-Node connection, a broken Agent-to-source-broker (or source-broker-to-Agent) connection, faulty source streams or dead-letter-queue (DLQ) backpressure — and faster troubleshooting.
Agent and Source Health Checks
Agents and Sources have independent Health Checks:
- Agent Health Checks monitor the Agent's connectivity and internal reliability — e.g. the Agent-to-Node connection, the Agent-to-source-broker connection, MQTT client health, enrollment certificate availability, dead-letter-queue (DLQ) pressure and stalled streams.
- Source Health Checks monitor the Source's own connectivity and its streams — e.g. the source-broker connection back to the Agent and faults in the Source's streams — plus protocol-specific conditions (OPC-UA server state, ADS/PLC readiness, MQTT subscriptions, REST post-failure ratios).
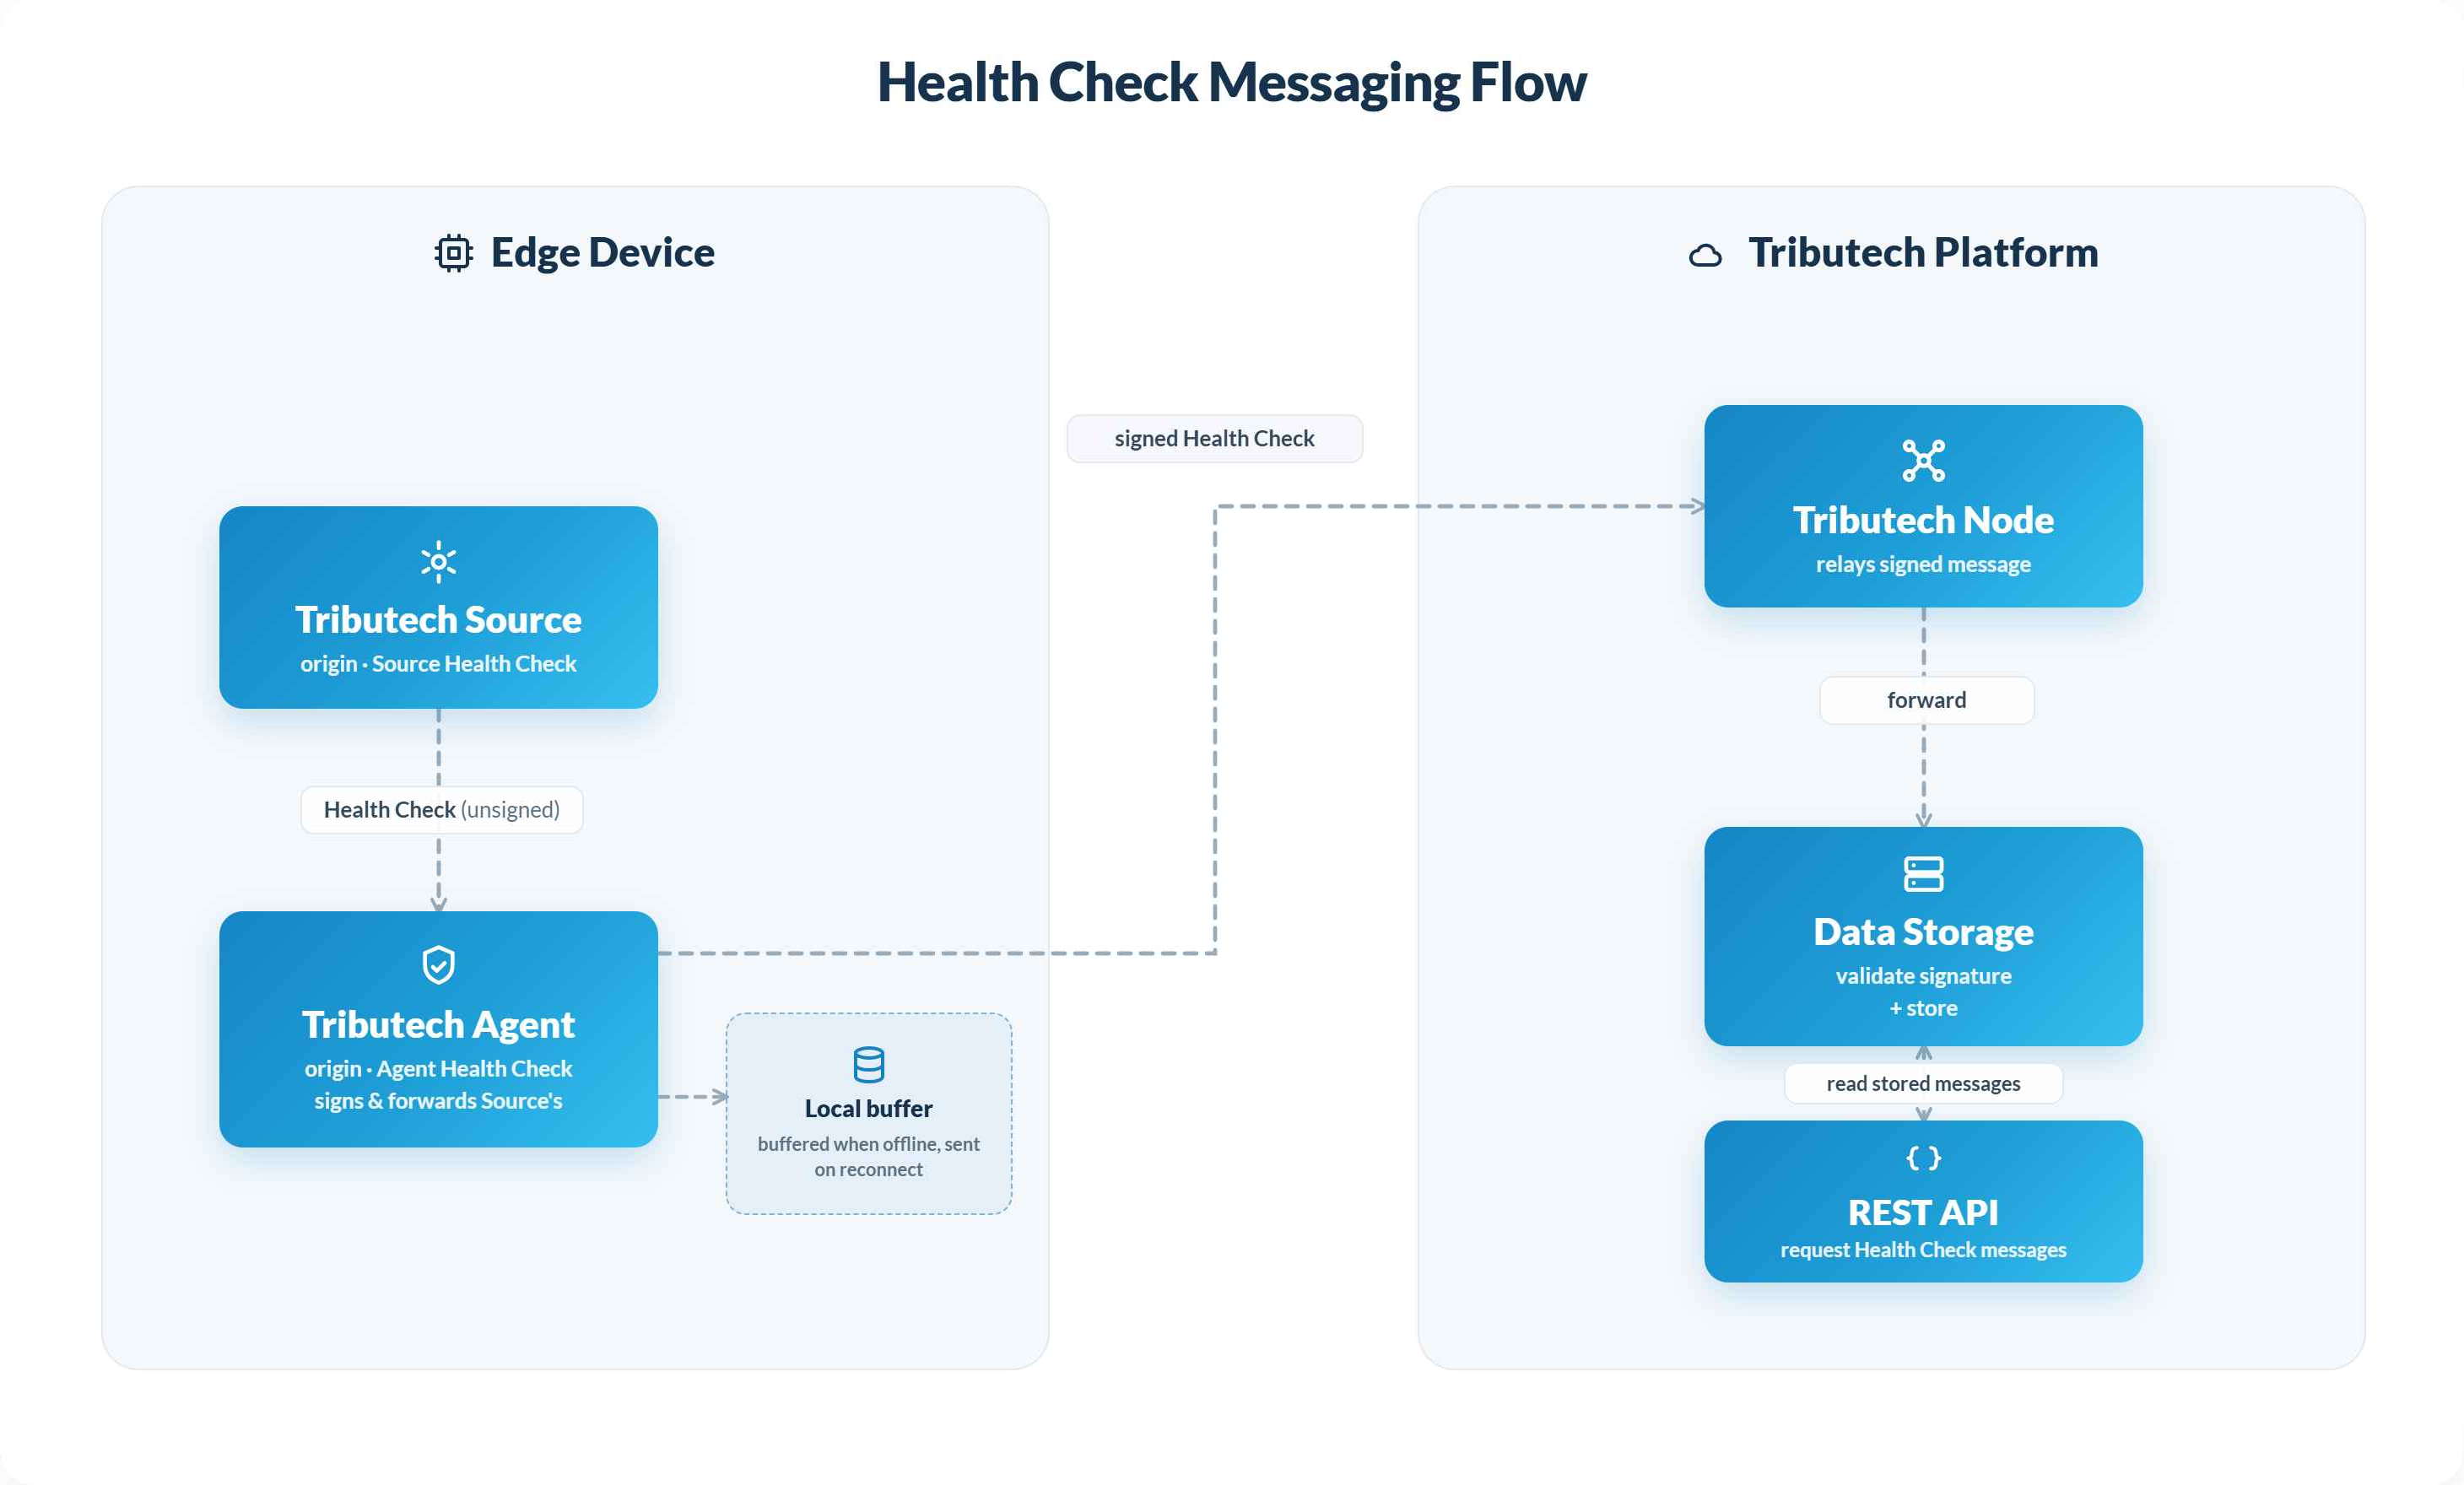
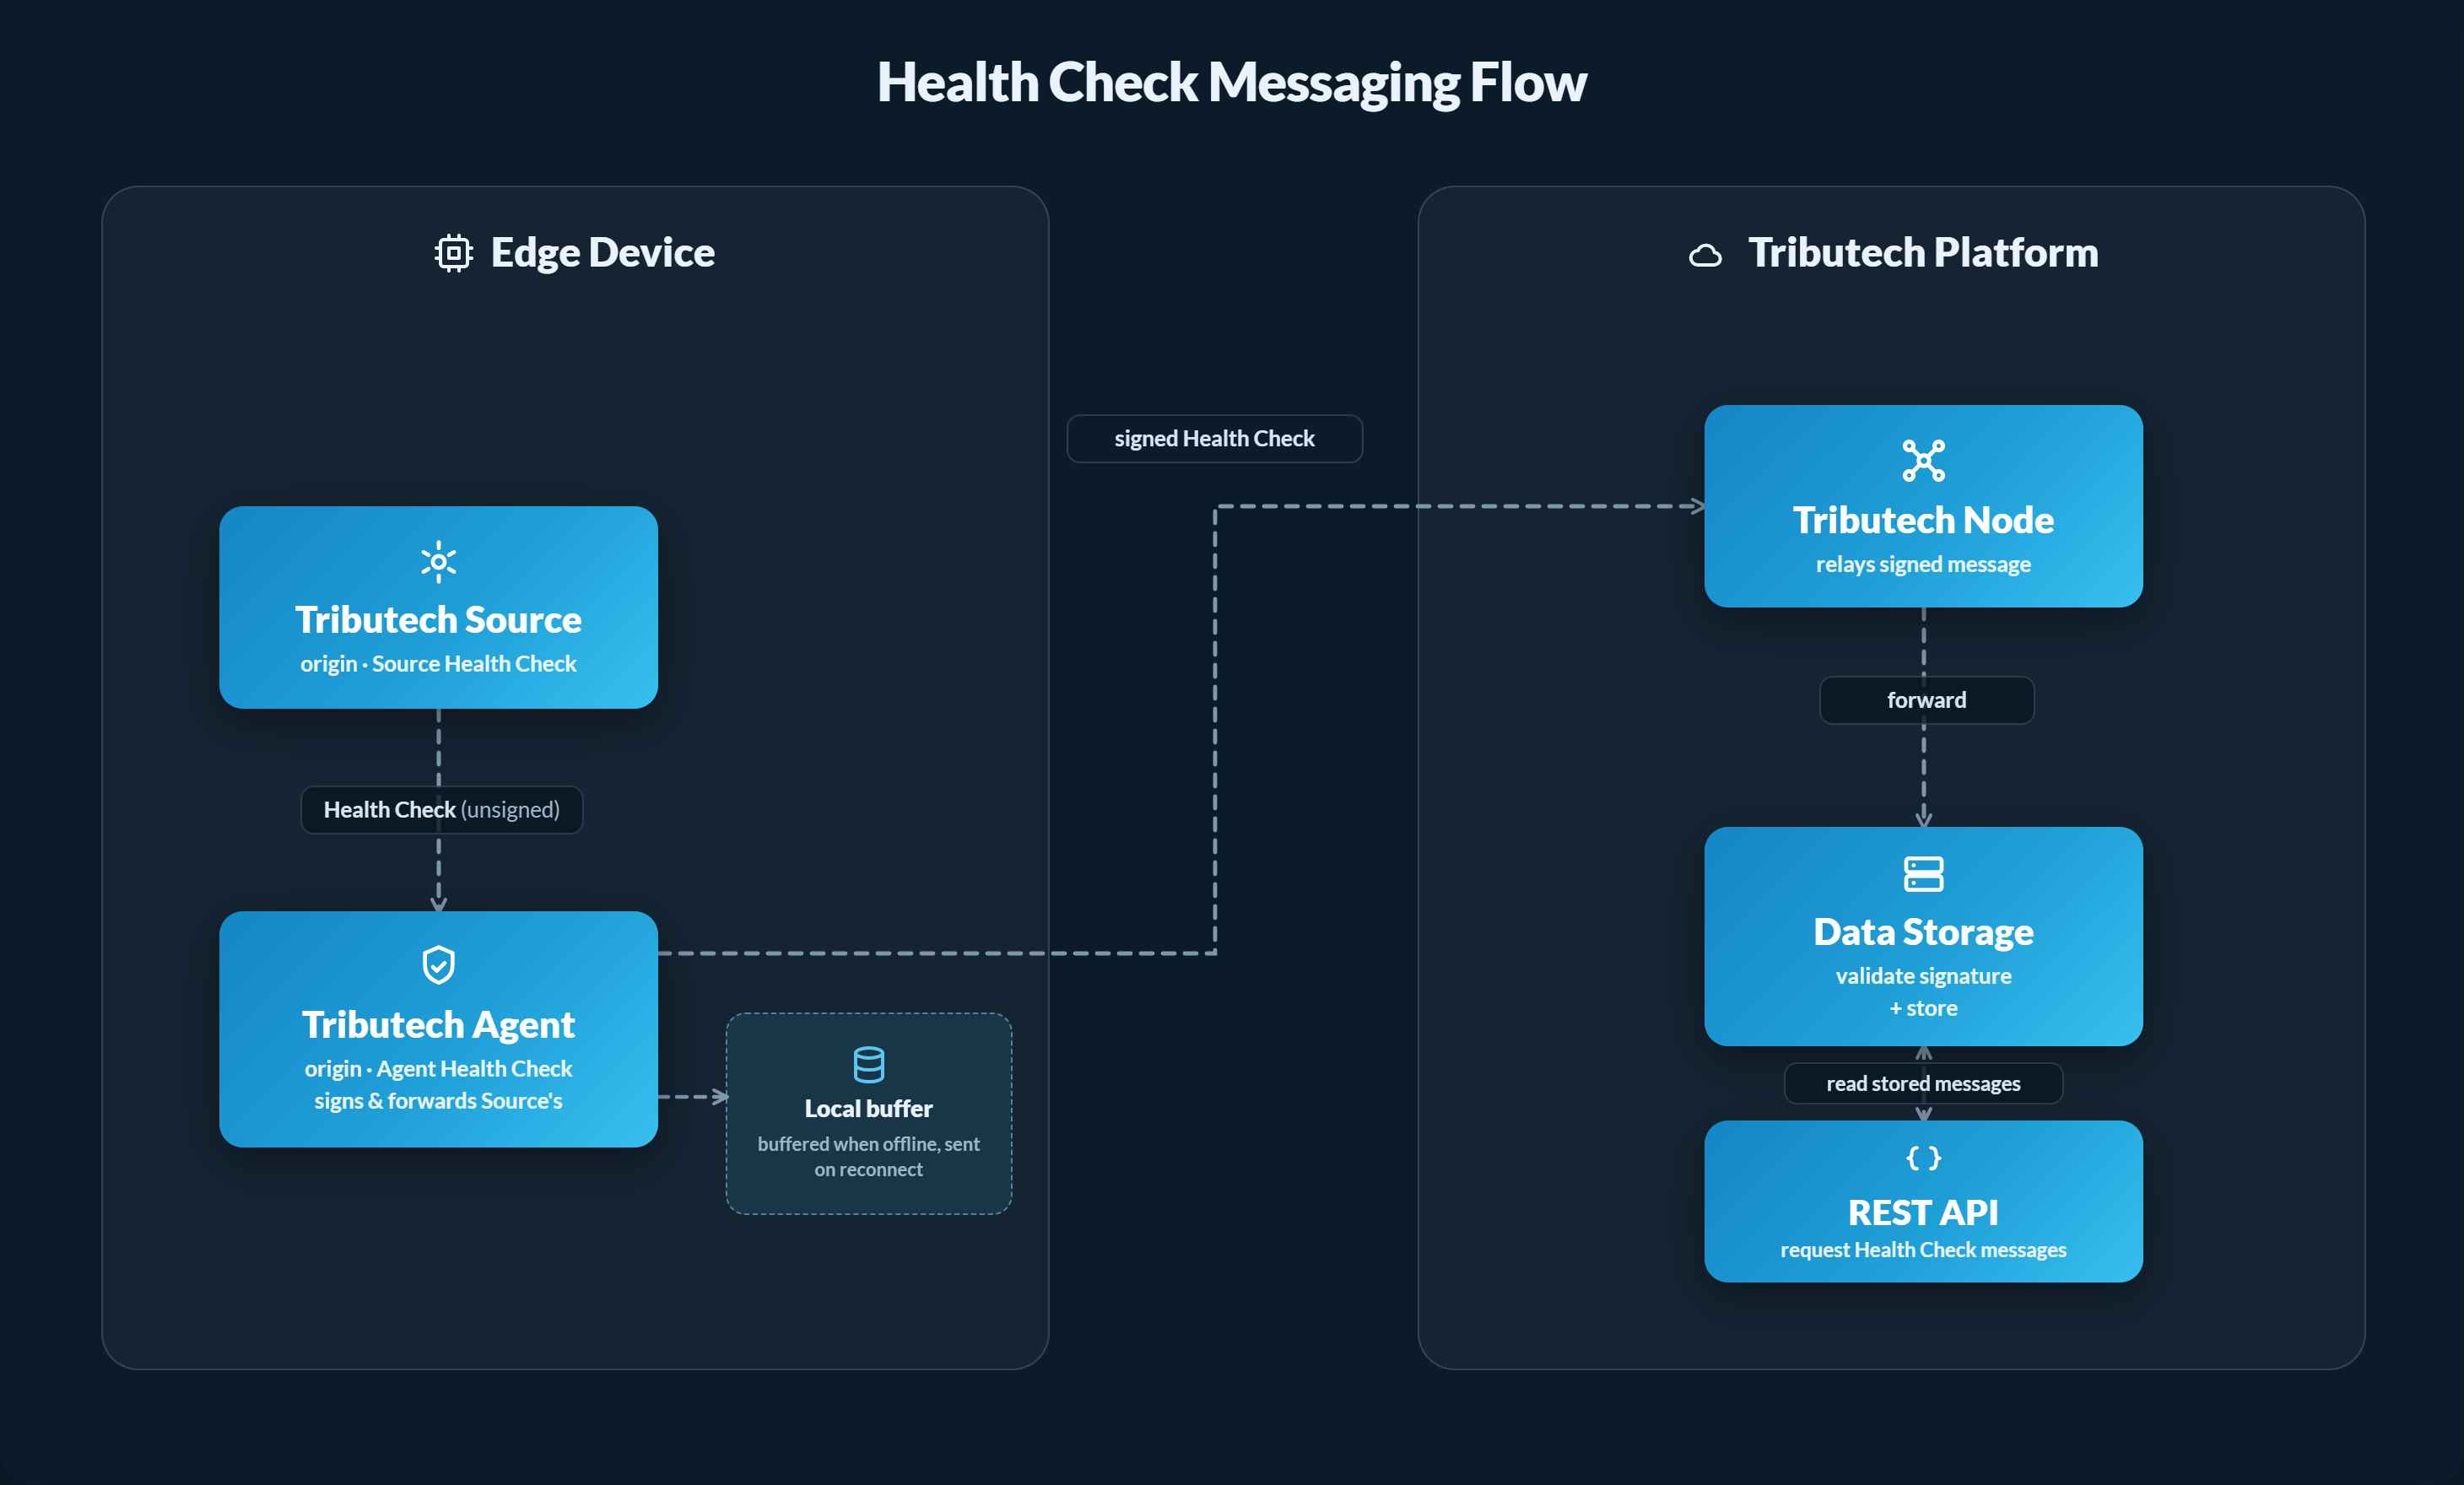
A Source does not talk to the Tributech Node directly: it sends its Health Check to the Agent, and the Agent signs and forwards it to the Tributech Node, which verifies the signature and stores it.
Message structure
Health Checks are transmitted as structured JSON. A Health Check consists of a signed envelope and the payload carrying the actual health data. The example below shows a complete Agent Health Check of a healthy Agent:
{
  "messageId": "01a0c951-444a-7d6b-916a-0a4350f6aa52",
  "dtId": "2404fc19-8204-47f1-9942-f42a1831dbfd",
  "healthState": "Ok",
  "healthTimestamp": "2026-09-22T13:32:21.450762+00:00",
  "signature": "ggrn2E0JSggymskdalSvCglpyVbWIdzx...DGU2lipgmPrj",
  "signatureTimestamp": "2026-09-22T13:32:21.453132+00:00",
  "payload": {
    "$dtId": "2404fc19-8204-47f1-9942-f42a1831dbfd",
    "$telemetryMetadata": {
      "$model": "dtmi:io:tributech:healthmessage:edge;2"
    },
    "healthState": "Ok",
    "healthMessage": "Agent is healthy.",
    "healthTimestamp": "2026-09-22T13:32:21.450762+00:00",
    "expectedHealthFrequency": "00:00:10",
    "snapshot": {
      "dlqQueuePercentage": 0,
      "isNodeMqttClientHealthy": true,
      "isConnectedToCloudBroker": true,
      "isInInitialConfiguration": false,
      "isConnectedToSourceBroker": true,
      "isSourceMqttClientHealthy": true,
      "enrollmentCertificatesExist": true
    },
    "windowed": {
      "dlqFullCount": 0,
      "ageLimitHitStreams": [],
      "nodeBrokerDisconnectionCount": 0,
      "sourceBrokerDisconnectionCount": 0,
      "nodeMqttClientWasUnhealthyCount": 0,
      "sourceMqttClientWasUnhealthyCount": 0,
      "twinWasClearedDueToEnrollmentFailureCount": 0
    }
  }
}
The envelope carries the identity and the signature of the message:
| Field | Description |
|---|---|
messageId | Unique identifier of this Health Check message |
dtId | Digital Twin identifier of the Agent or Source that sent it |
healthState | The state from the payload, repeated on the envelope |
healthTimestamp | Time the health data was collected (UTC) |
signature | Signature over the payload, used to verify the message came from that device unaltered |
signatureTimestamp | Time the signature was created (UTC) |
payload | The health data itself, described below |
The following fields are present in the payload of every Health Check:
| Field | Description |
|---|---|
$dtId | Digital Twin identifier of the Agent or Source |
$telemetryMetadata.$model | Digital Twin model used to interpret the message |
healthState | Machine-readable health status (see below) |
healthMessage | Human-readable status description |
healthTimestamp | Time the health data was collected (UTC) |
expectedHealthFrequency | Reporting interval the message was produced with, as hh:mm:ss |
expectedHealthFrequency is configured as an ISO 8601 duration (e.g. PT30S, see Configuration), but it is reported back in the hh:mm:ss form — 00:00:10 in the example above is a ten second interval.
The remaining fields are diagnostic indicators that differ between the Agent and each Source type. On the Agent they are grouped into snapshot and windowed indicators.
healthState values:
| Value | Meaning |
|---|---|
Ok | The component is operating normally. |
Degraded | Something is wrong, or briefly went wrong, but the component keeps working. |
Unhealthy | The component is impaired. |
Critical | The component cannot do its job. |
Unknown | No state could be determined. |
Snapshot and windowed indicators
An Agent reports its diagnostic indicators in two groups, which answer two different questions.
- Snapshot indicators are read at the moment the health tick fires. They answer "what is true right now?".
- Windowed indicators cover the whole interval since the previous Health Check. They answer "did this go wrong at any point in between?".
The distinction matters because a problem that appears and recovers between two ticks would otherwise be invisible. A brief interruption of the connection to the Tributech Node, a dead-letter queue that briefly ran full, or a stream that hit its Merkle age limit can all be over by the time the next message is assembled — and the Agent would simply report Ok, with nothing to show that anything had happened. The windowed indicators count these events as they occur and are reset with every Health Check, so each message describes the interval it covers rather than a single instant.
The counters answer how often, not how long: a value of 2 means the condition occurred twice since the last message, regardless of how long it lasted.
The value of the windowed group shows when an interruption has already passed. In the excerpt below the
connection to the Tributech Node dropped once and recovered before the message was sent. Every snapshot value
is healthy, but the windowed counters still report what happened, so the Agent reports Degraded instead of
Ok and names the reason in healthMessage:
"healthState": "Degraded",
"healthMessage": "Cloud broker was disconnected 1 time(s) during the reporting period.",
"snapshot": {
  "isConnectedToCloudBroker": true,
  "isNodeMqttClientHealthy": true
},
"windowed": {
  "nodeBrokerDisconnectionCount": 1,
  "nodeMqttClientWasUnhealthyCount": 1
}
A single interruption often raises more than one counter. In the example above the dropped connection is
counted both as a disconnection and as an unhealthy MQTT client, because the client cannot publish while the
connection is down. Two counters at 1 here describe one event from two angles, not two separate problems.
An Agent Health Check reports the following indicators:
| Indicator | Group | Meaning |
|---|---|---|
snapshot.isConnectedToSourceBroker | Snapshot | The Agent is connected to the source broker right now. |
snapshot.isConnectedToCloudBroker | Snapshot | The Agent is connected to the Tributech Node right now. |
snapshot.enrollmentCertificatesExist | Snapshot | The enrollment certificates are present. |
snapshot.isSourceMqttClientHealthy | Snapshot | The MQTT client towards the sources is publishing normally. |
snapshot.isNodeMqttClientHealthy | Snapshot | The MQTT client towards the Tributech Node is publishing normally. |
snapshot.dlqQueuePercentage | Snapshot | Current fill level of the dead-letter queue, in percent. |
snapshot.isInInitialConfiguration | Snapshot | true while the Agent still runs on the initial twin it was enrolled with, before any Sources or Streams have been configured. It turns false once the Agent has been configured, which is the normal state for an Agent in operation. Note that this is the one indicator where false is the good value. |
windowed.sourceBrokerDisconnectionCount | Windowed | How often the source broker connection dropped during the interval. |
windowed.nodeBrokerDisconnectionCount | Windowed | How often the connection to the Tributech Node dropped during the interval. |
windowed.sourceMqttClientWasUnhealthyCount | Windowed | How often the MQTT client towards the sources went unhealthy. |
windowed.nodeMqttClientWasUnhealthyCount | Windowed | How often the MQTT client towards the Tributech Node went unhealthy. |
windowed.dlqFullCount | Windowed | How often the dead-letter queue reached 100%, which means messages may have been lost. Only the transition to full is counted, not every message that arrives while it stays full. |
windowed.twinWasClearedDueToEnrollmentFailureCount | Windowed | How often the twin was cleared because enrollment failed. This is an event with no current-state counterpart, so it exists only as a windowed value. |
windowed.ageLimitHitStreams | Windowed | The streams whose Merkle proof hit its age limit during the interval. A stream stays in this list for the interval even if later batches complete normally. |
The field for the connection to the Tributech Node is called nodeBrokerDisconnectionCount, while its snapshot counterpart is called isConnectedToCloudBroker. Both describe the same connection.
How the Agent's health state is derived
The conditions below are evaluated in order and the first match wins. Because the Critical conditions test the connections as they are right now, a connection that dropped but has since recovered can never be reported as Critical — it falls through to Degraded.
| Health State | Any of these conditions |
|---|---|
Critical | Currently not connected to the source broker; currently not connected to the Tributech Node; the twin was cleared due to an enrollment failure during the interval; the dead-letter queue is currently above 80%; the dead-letter queue reached 100% during the interval. |
Unhealthy | The dead-letter queue is currently above 50%. |
Degraded | Enrollment certificates are currently missing; the source broker or the Tributech Node connection dropped during the interval but is connected again; either MQTT client is unhealthy now or was unhealthy during the interval; one or more streams hit their Merkle age limit during the interval; the dead-letter queue is currently above 20%. |
Ok | None of the above. |
A few examples of how the two groups combine:
| Situation | At tick time | During the interval | Reported |
|---|---|---|---|
| The Node connection dropped and recovered | Connected | nodeBrokerDisconnectionCount = 1 | Degraded |
| The Node connection is still down | Disconnected | nodeBrokerDisconnectionCount = 1 | Critical |
| The dead-letter queue ran full, then drained | 5% | dlqFullCount = 1 | Critical |
| The dead-letter queue climbed and stayed there | 30% | dlqFullCount = 0 | Degraded |
| A stream hit its Merkle age limit, later batches were fine | Not age-limited | Stream listed in ageLimitHitStreams | Degraded |
| Nothing unusual happened | All healthy | All counters 0 | Ok |
Note that a dead-letter queue which ran full is reported as Critical even after it has drained, because reaching 100% means messages may have been dropped.
Configuration
Health Checks are enabled through the Digital Twin configuration via the ExpectedHealthFrequency property (an ISO 8601 duration, e.g. PT30S) — on a Digital Twin model version that supports it (see the requirements above).
If the interval is missing, empty or invalid, the Agent falls back to a 30-minute reporting interval. This keeps Health Checks running, but at a much lower resolution.
If connectivity to the Tributech Node is temporarily unavailable, Health Checks continue to be generated and are stored in a size-limited local buffer (oldest entries are overwritten first) and transmitted once communication is restored.
Accessing Health Checks
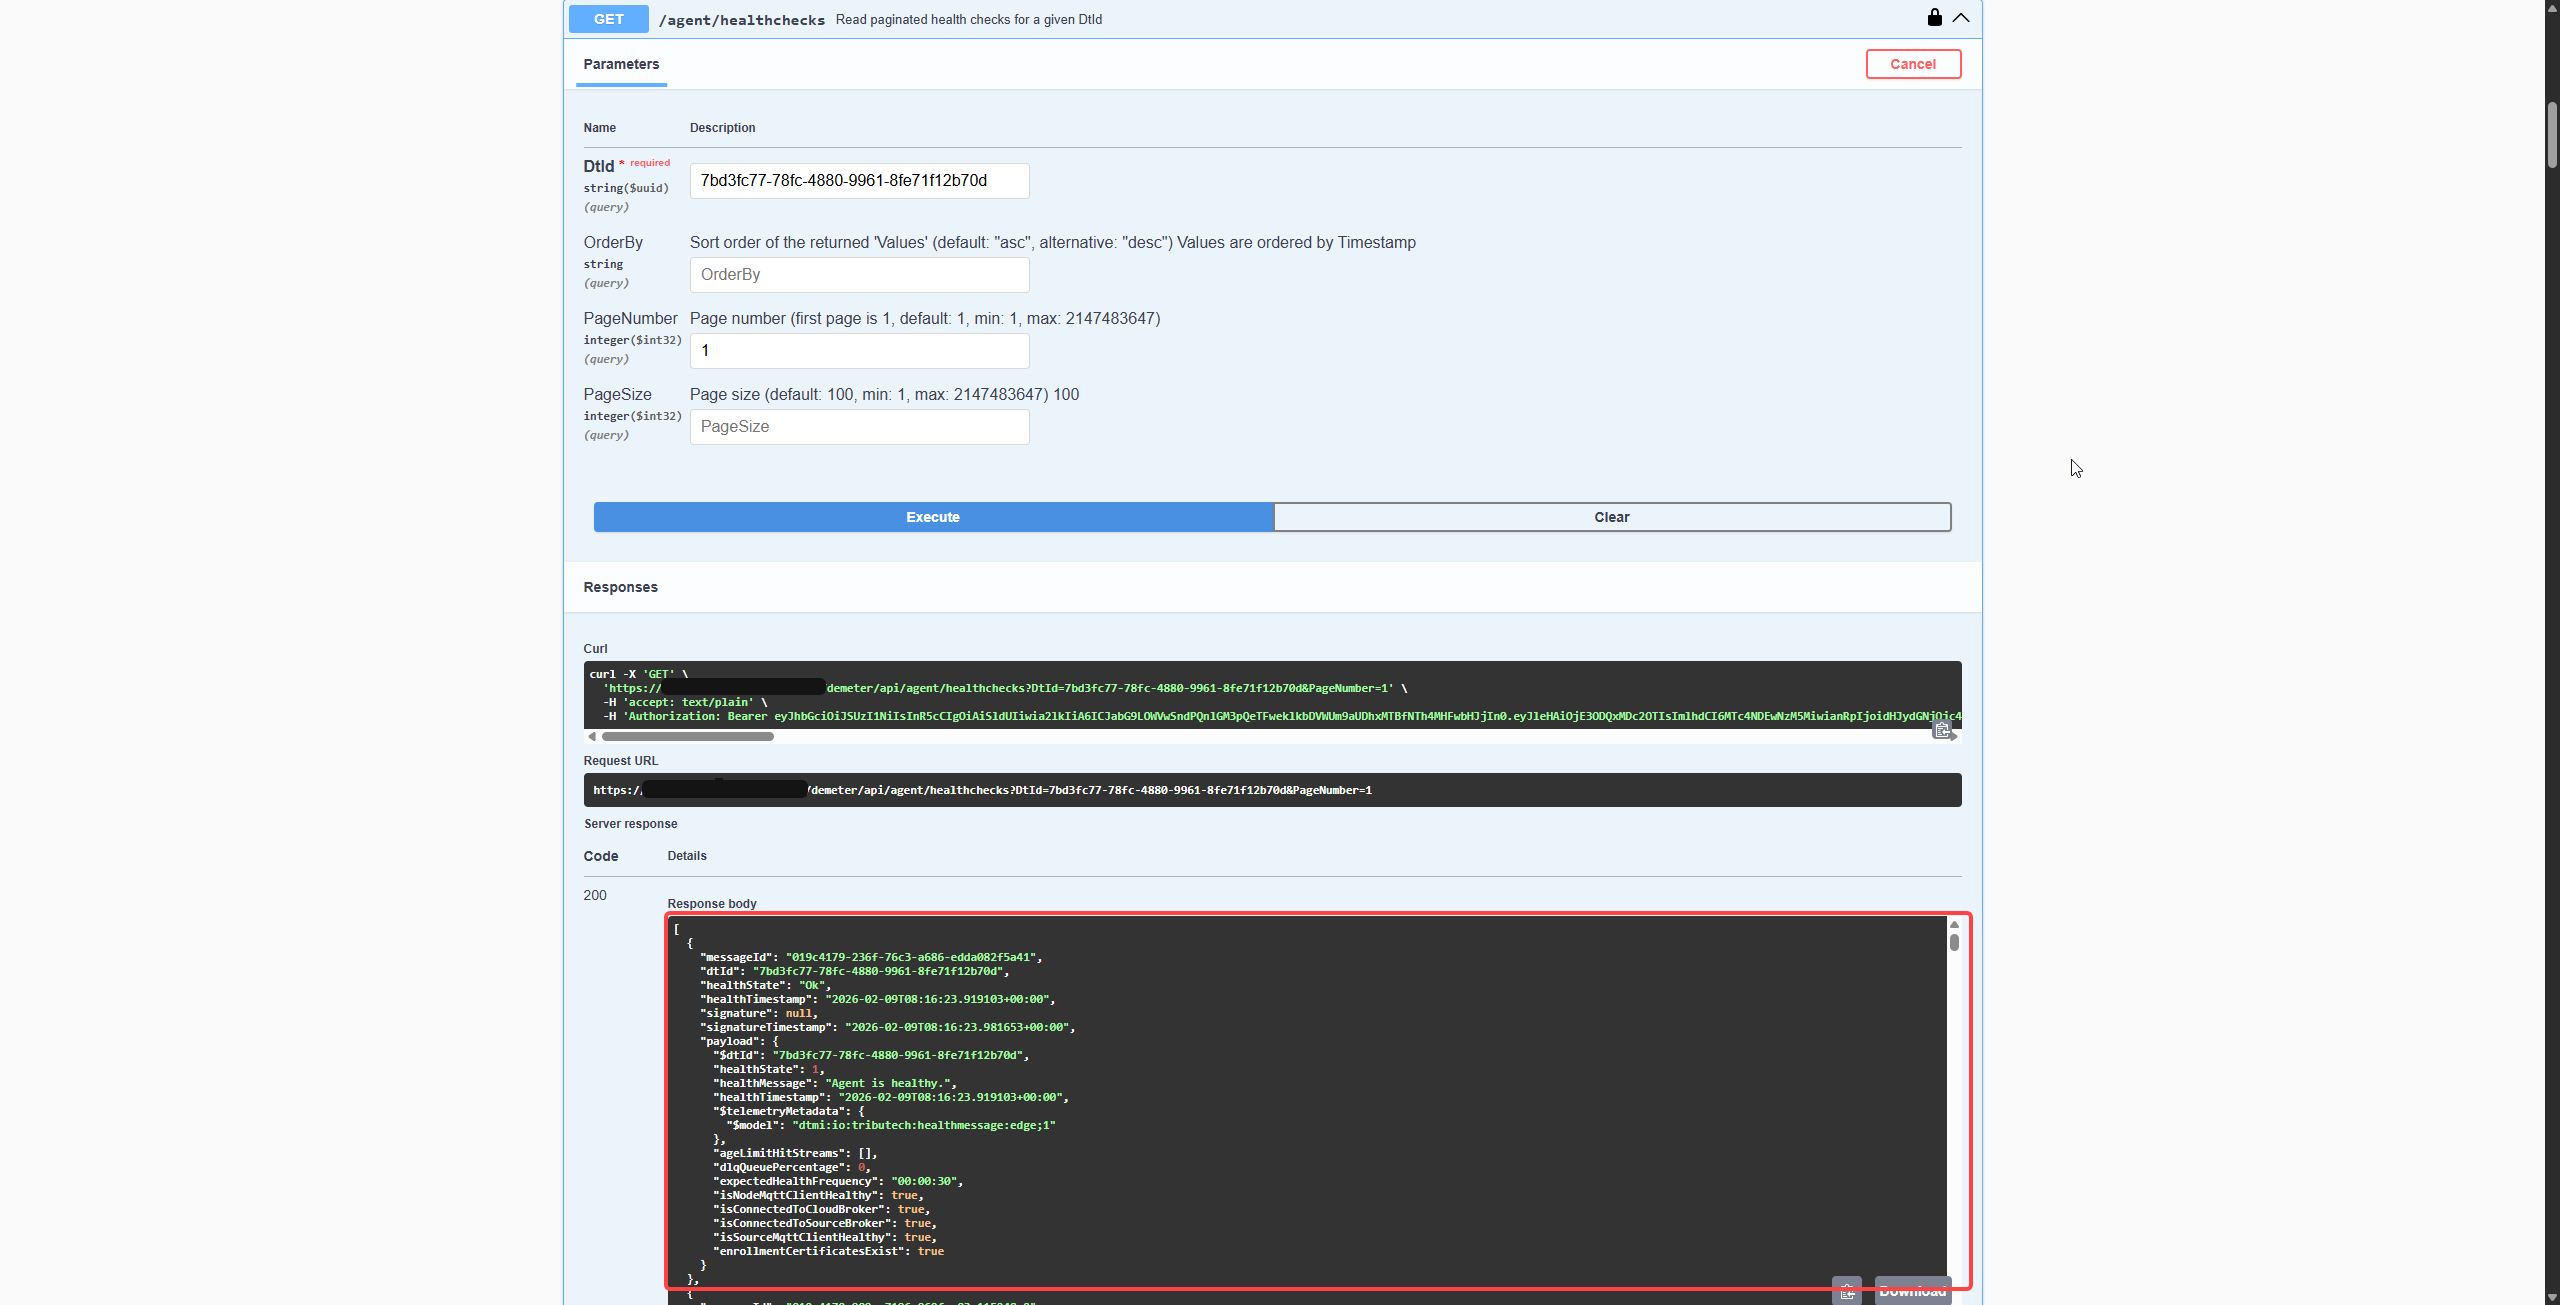
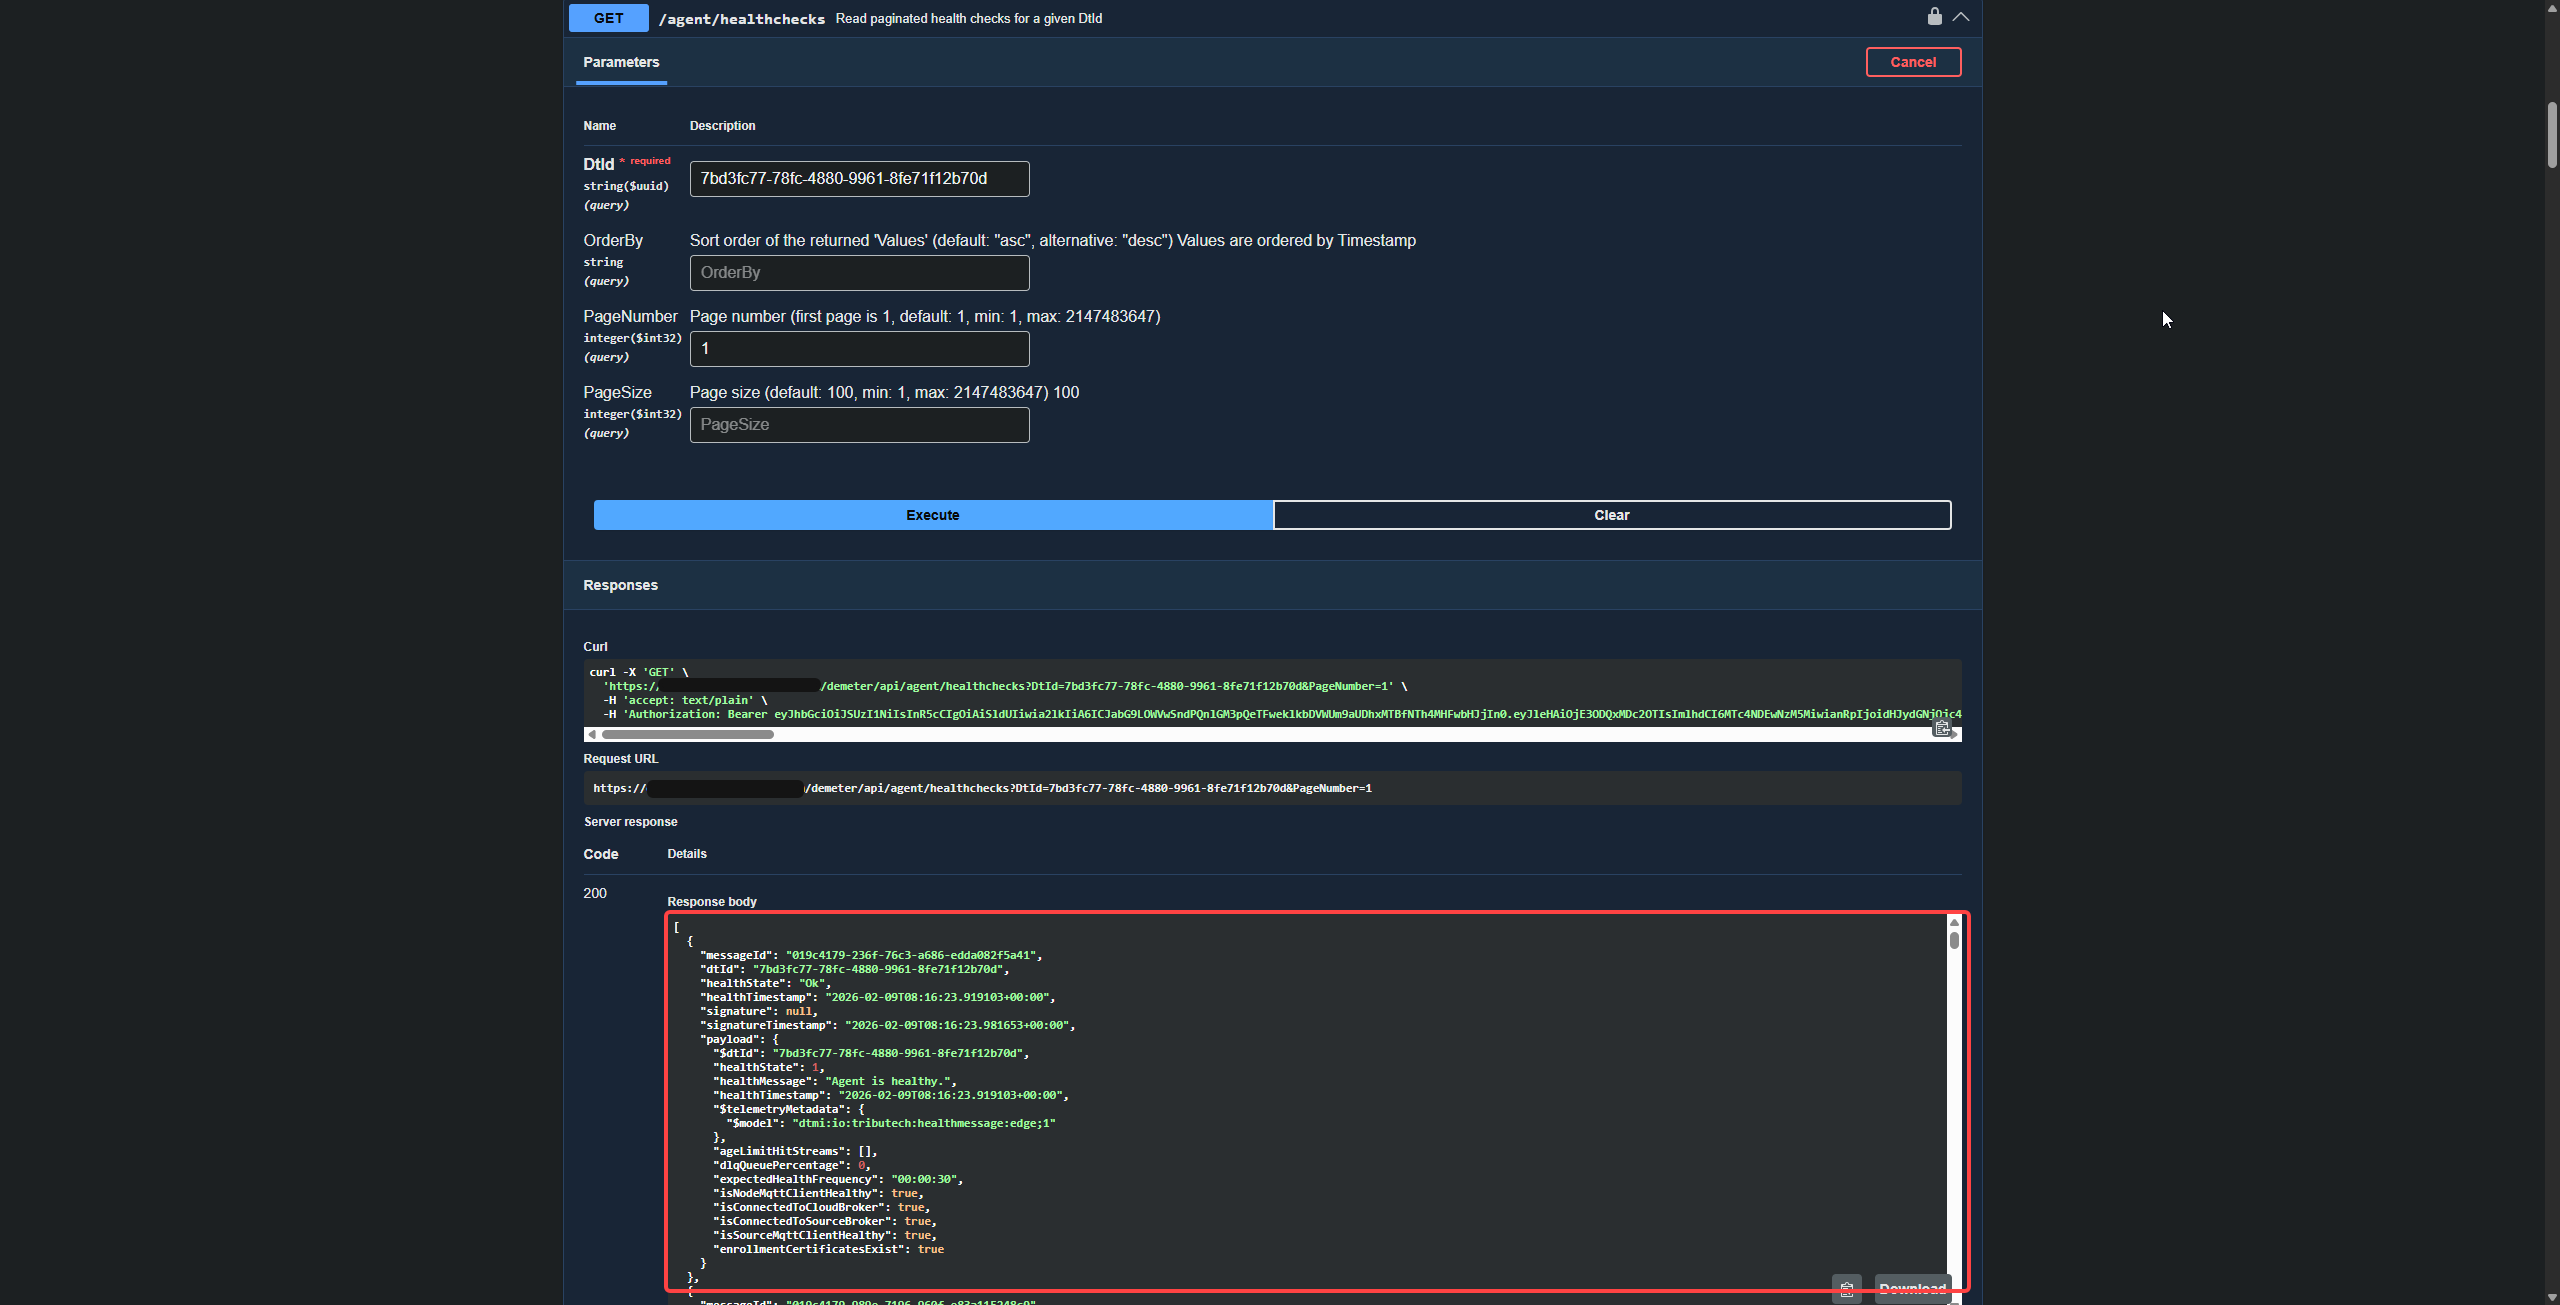
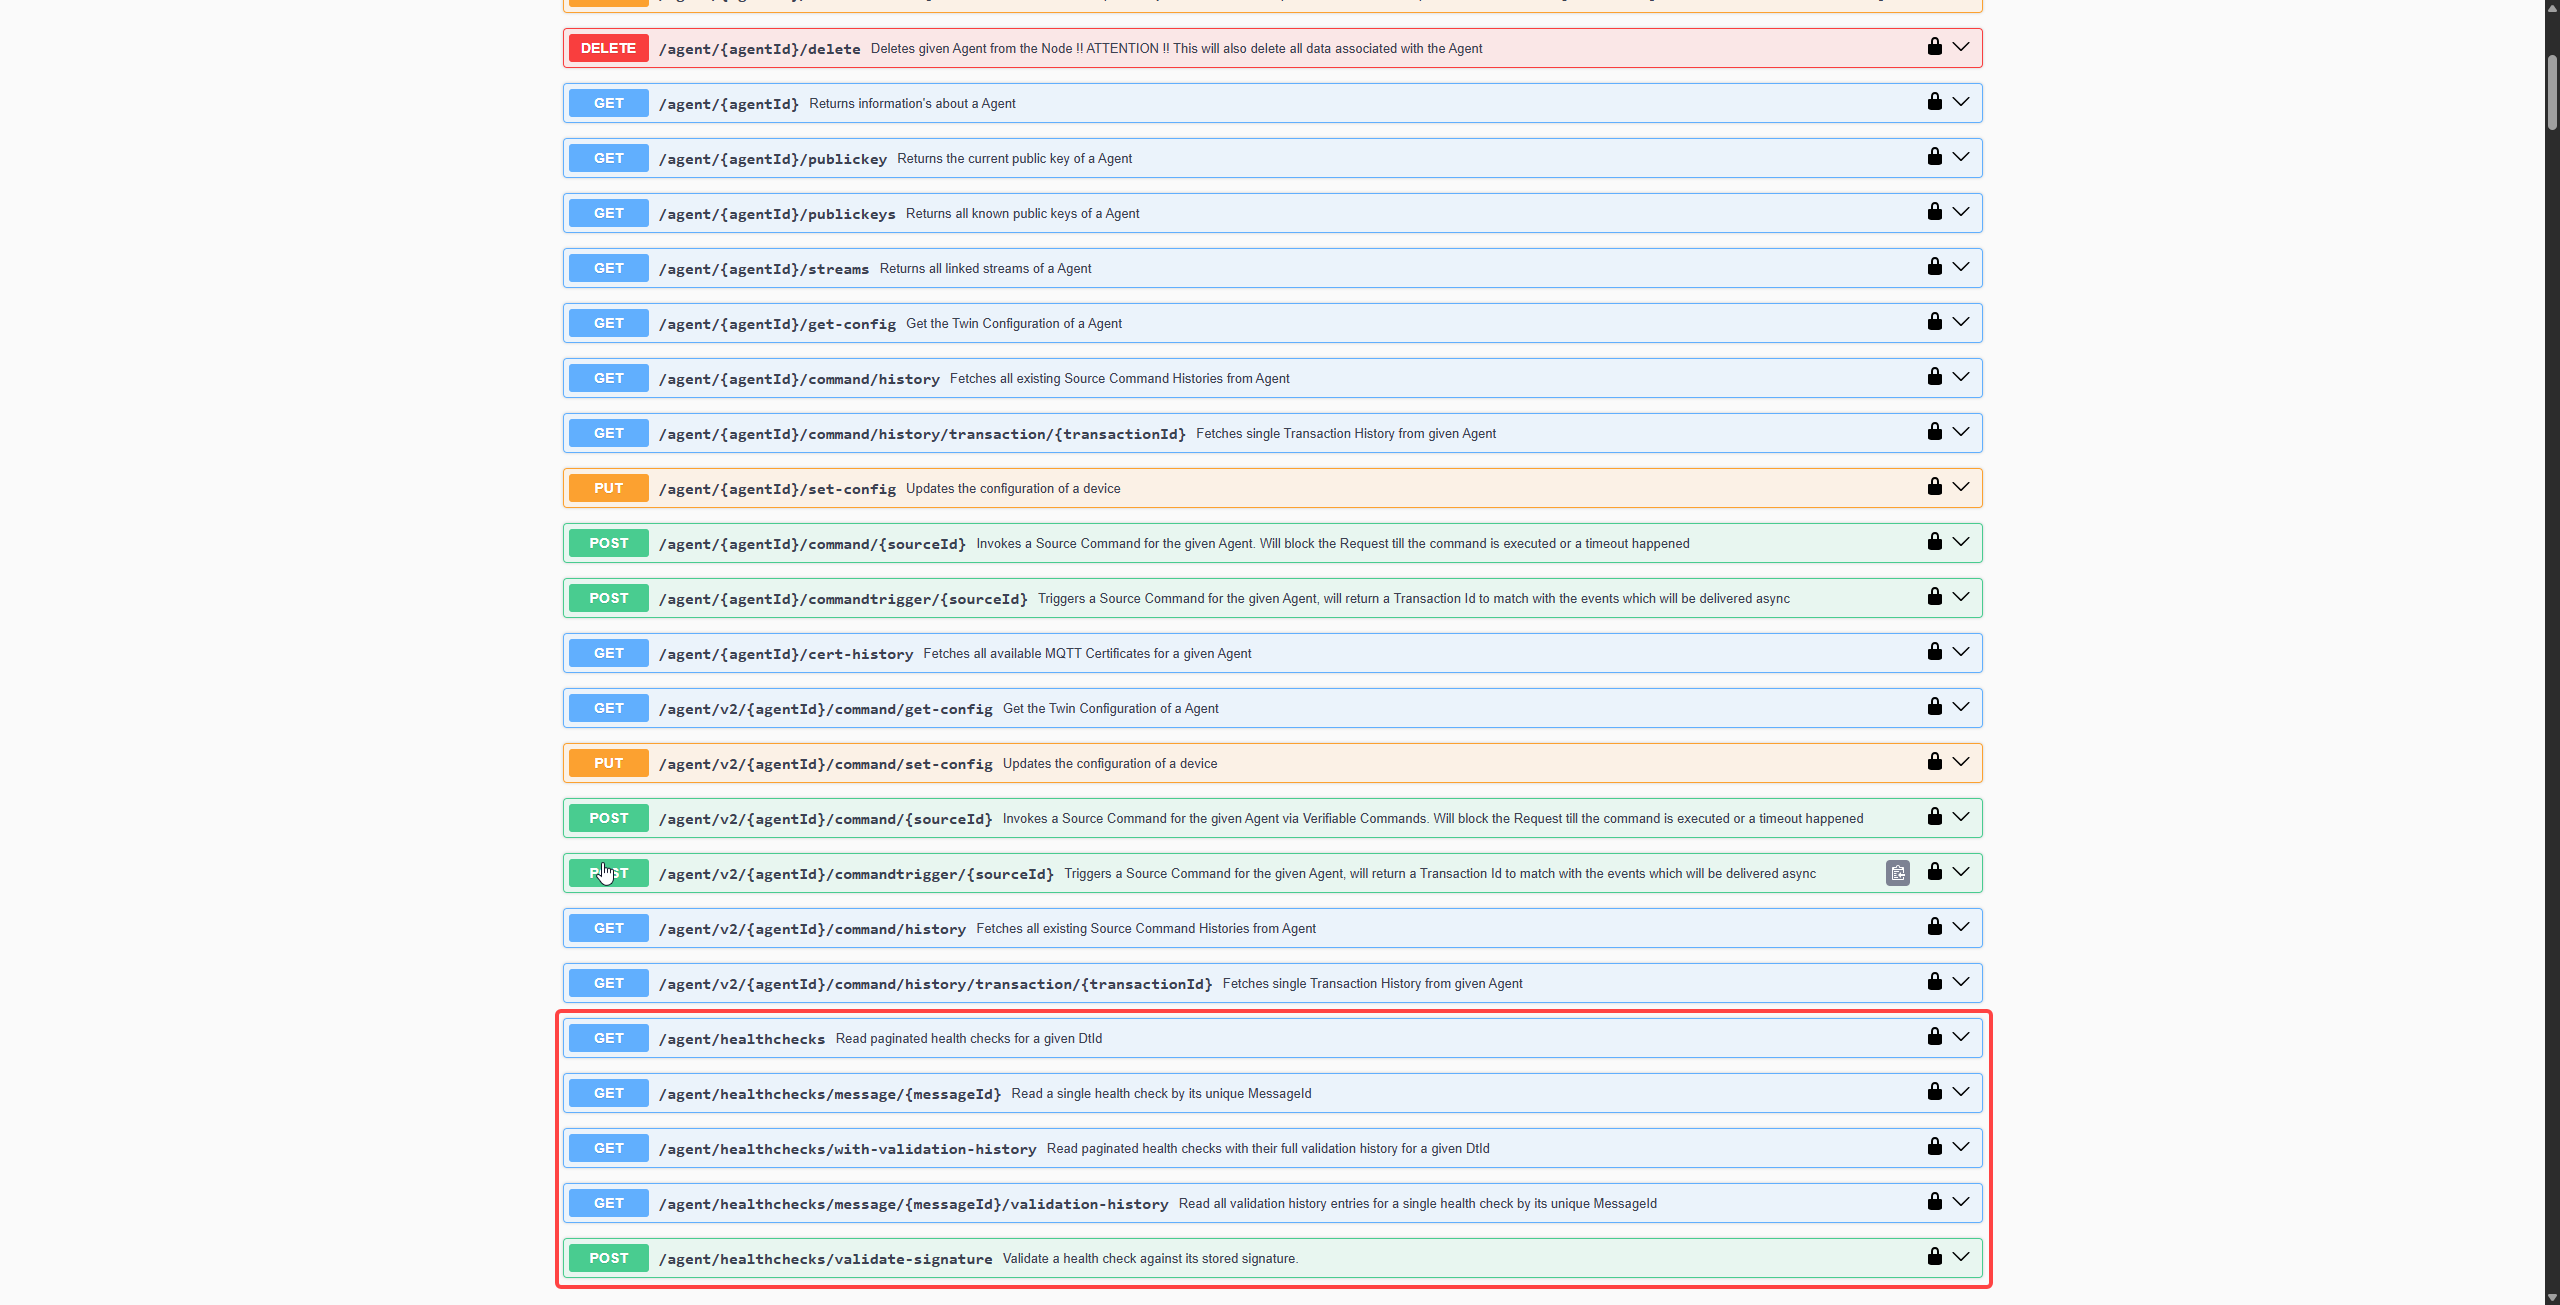
Health Check results are retrieved through the Tributech Node REST API. Both the stored health payloads and the result of their signature validation are available there.
The Health Check endpoints are available in the Swagger UI:
An example Health Check response: